The Mac Techs @ Sheridan
INTRODUCTIONS TO IMOTIONS
IMotions is a software that can be great to get user feedback on your application. The software has
many different methods that can help developers determine what parts the users can like, and dislike
based on their attention to certain parts of the layout.
Contents:
Basic Guide
- Setting up Eye Tracker
- Setting up IMotions
- Adding FACET to Study
- Starting a New Study
- Adding New Stimuli to Study
- Adding Respondents
- Starting a Study
- Analyzing Study
- Third-Party Software
- How to Export Data
Advanced Guide
- Shimmer
- EEG
- Additional Stimuli
- Exporting Data
- Eye Tracking
- AOI Metrics per Respondent
- AOI Fixations per Respondent
- Moving AOI data
- Aggregate Moving AOI data
- Surveys
- Survey data per Respondent
- Full Survey Response
- Survey Statistics
- Annotations
- Marker Data
- Sensor Data
- Media
- Replay Videos
- Aggregate Videos
- Respondent Cam Recordings
- Environment Cam Recordings
- Screen/Scene Recordings
- EEG
- Frontal Asymmetrical
- Power Spectral Density
Basic Guide
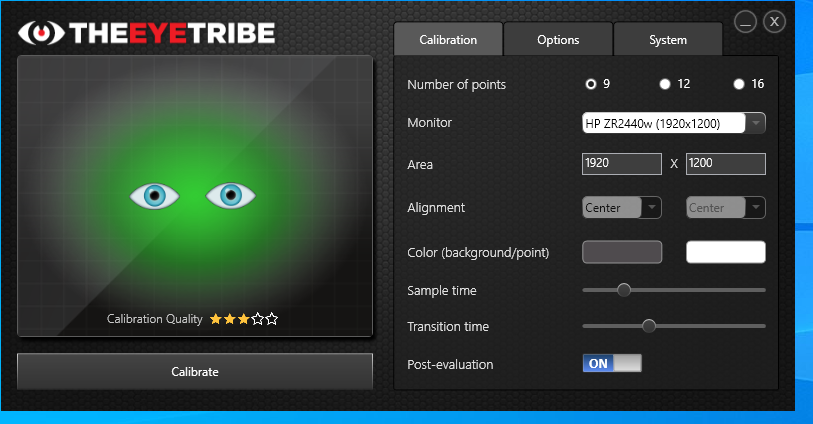
Setting up Eye Tracker
2. Calibrate position of the eyes. If rating is 3 stars(average) or up to 5 stars(excellent), then continue. Else repeat this step.
Setting Up IMotions
NOTE: You are required to setup the scanners for data collection.
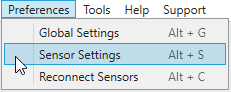
2. Click Preferences.
3. Click Sensor Settings
4. Scroll over to the Eye tracking tab
5. Click the Eye Tracking Server checkbox to allow data collection using the Eye tracker
6. Click the drop down menu and search for EYETRIBE ET1000. Then Click Ok
Adding to FACET to Study
1. Go to Preferences
2. Click Sensor Settings
3. Scroll over to Video Tab
4. Check Enable VideoCam Capture
5. Click the drop-down menu and search for HD Pro Webcam C920 (if it is not on by default)
6. Change the resolution size of the camera to 800 x 600@30
7. In the FACET category checkmark Face Landmarks, Head Pose, and Other Attributes (if not set up by default)
8. Check Enable Data Collection
9. Click Ok
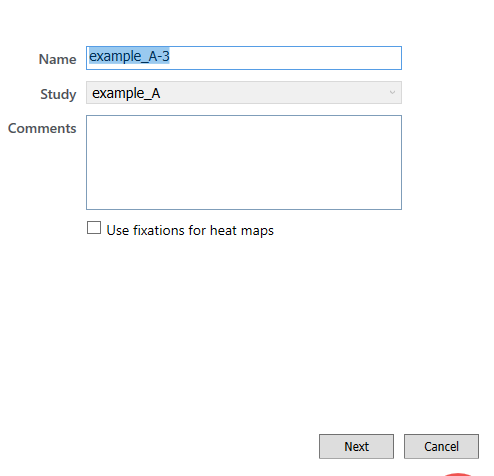
Starting a New Study
- Click Add Study to start a new Study
- Enter a name for the Study. Keep the rest at default and click Next
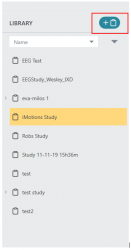
- Click Add New Study displayed on the top right hand corner next to the Library heading.
Adding New Stimuli to Study
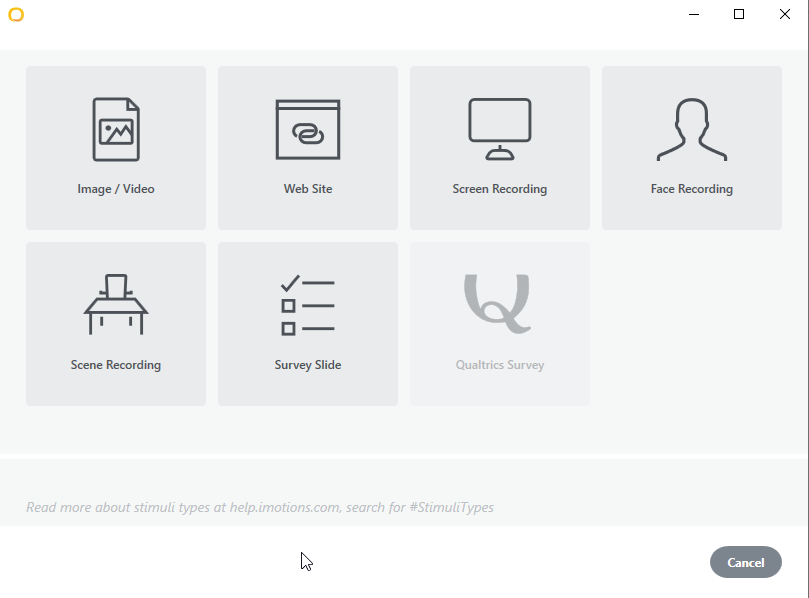
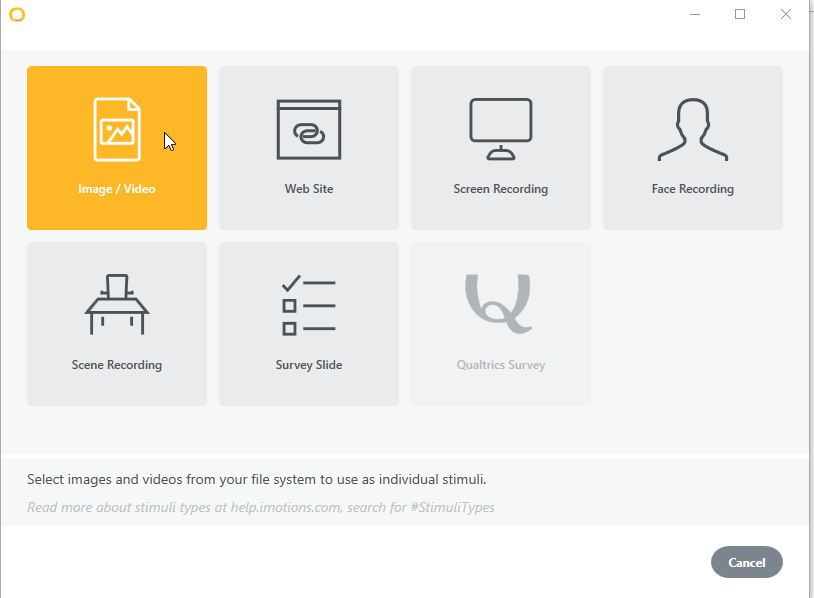
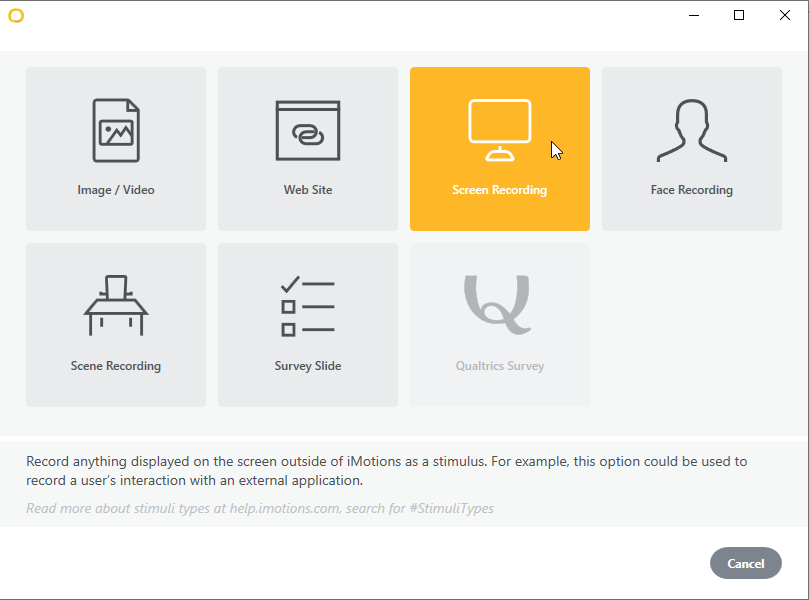
1. Click Add Stimuli to Study
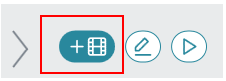
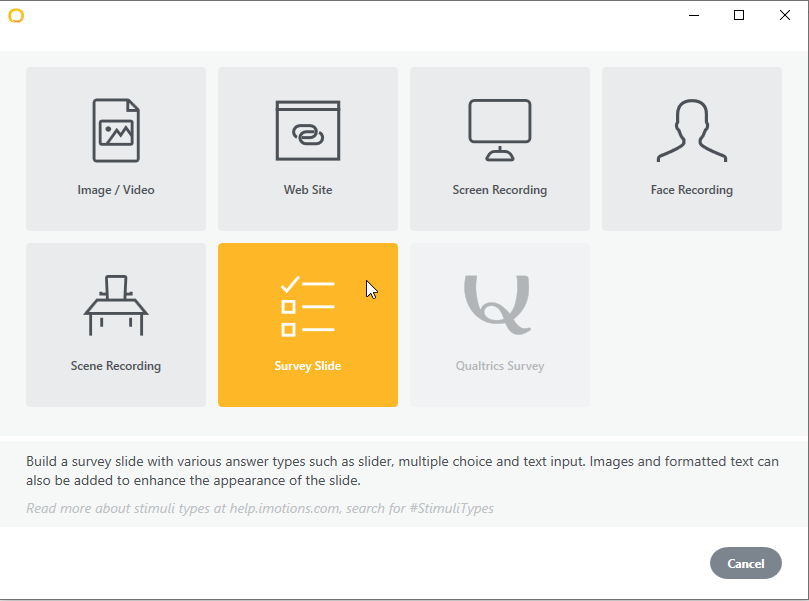
2. A menu screen will pop up and a variety of choice will be available for stimuli choice.
Website
i. Click the Website Icon.
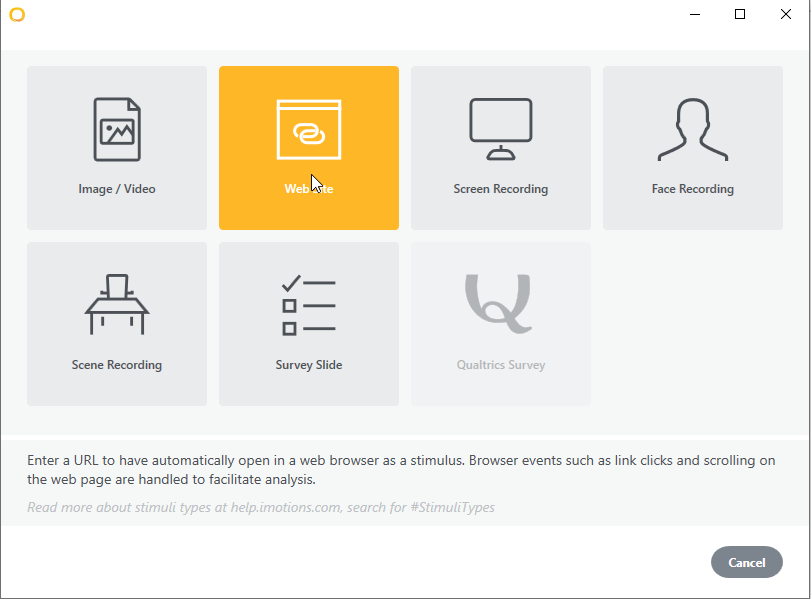
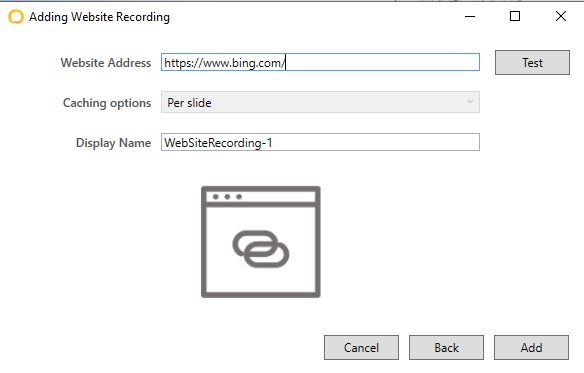
ii. Enter an address in the textbox beside the Website Address. Test to make sure the URL is correct.
Survey
i. Click the Survey Icon by clicking on the Add Stimuli icon again.
ii. Double click or drag elements found on the left panel to the grid canvas.
Here are some basic commands to know:
- Delete: press the delete button on your keyboard or right click on it and press delete
- Re-size: drag the corners of the rectangle surrounding the element
- Preview: Click the preview button located at the bottom left of the window
- Clear: Clears the entire page of survey elements. Located at the bottom left.
- Save: Save the element, located on the right side, bottom right
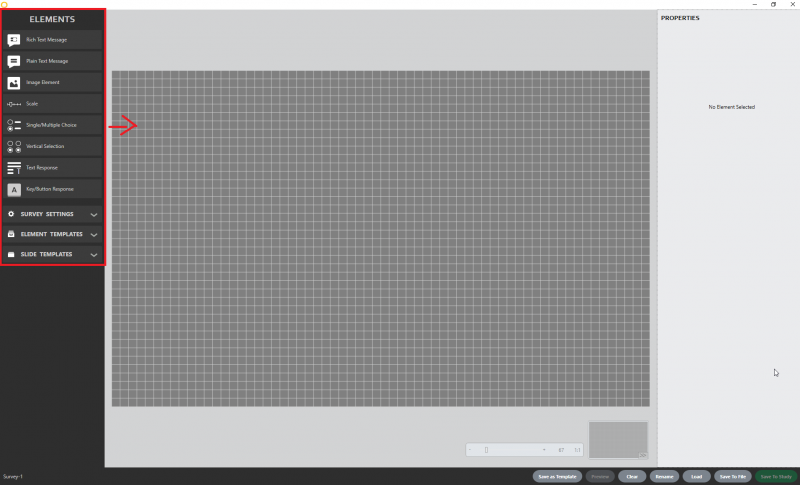
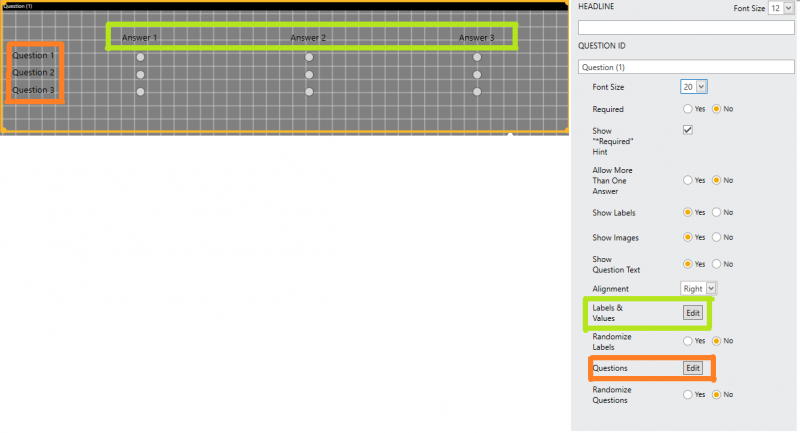
iii. Changing attributes can be done by selecting the desired element and changing its attributes in the right-hand pane.
iv. Click Save to Study.
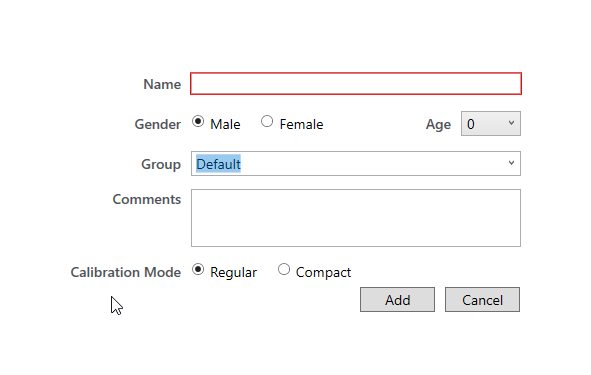
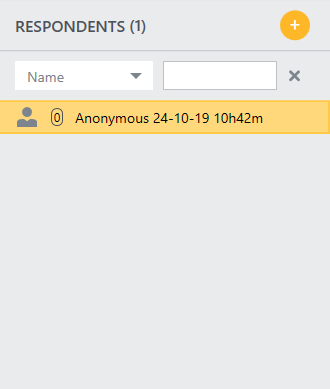
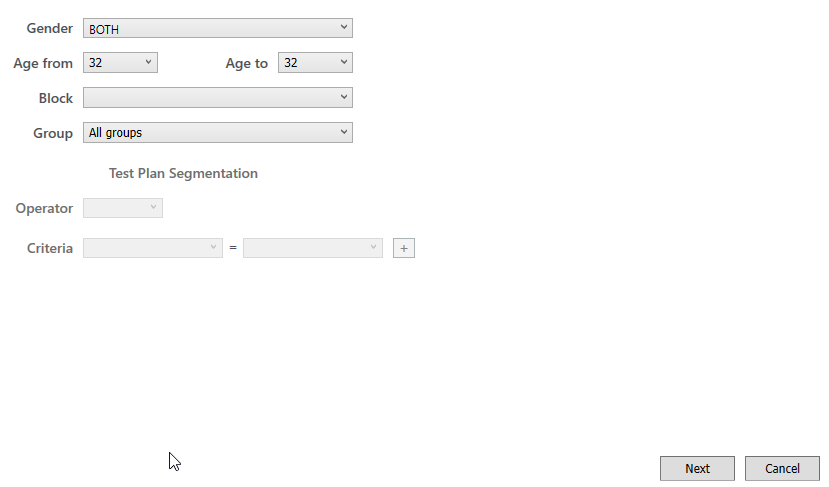
Adding Respondents
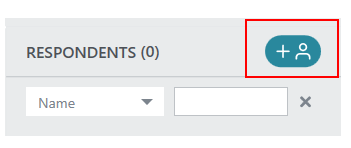
2. Only Gender and Age are mandatory, the rest are optional to fill in. Click Add
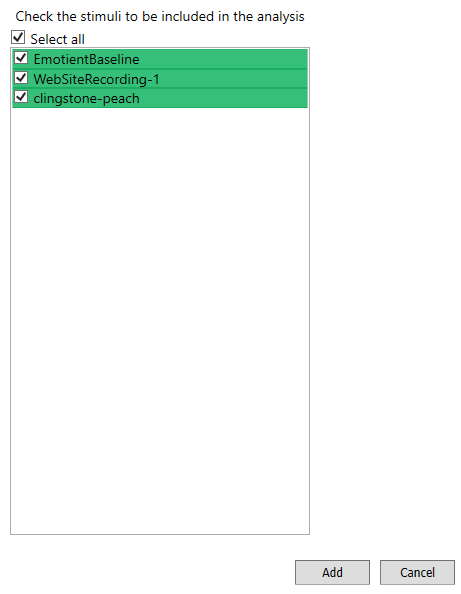
Starting a Study
3. Select which stimuli you want to test the respondent on
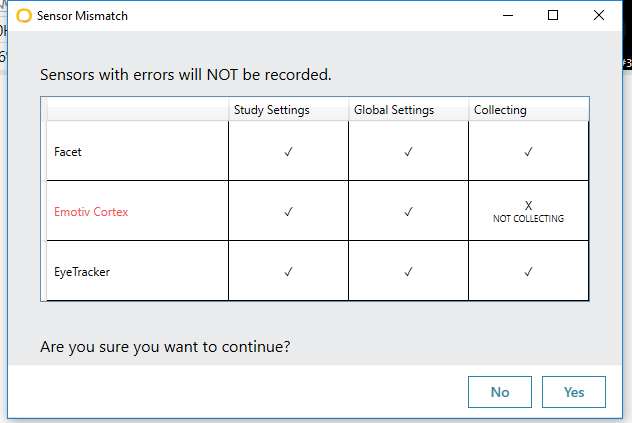
4. Hit Record.
5. A Sensor Mismatch pop up tells you which sensors are being used or not. Click Yes.
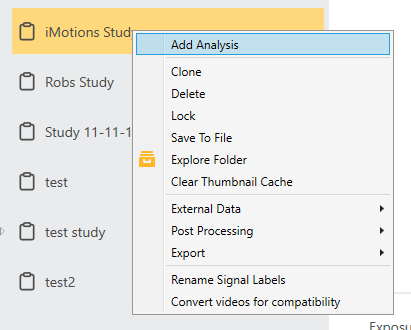
Analyzing Study
- Click Add Analysis by right clicking on your chosen study.
2. Click Next
3. Click Next
4. Click Next
5. Click Add
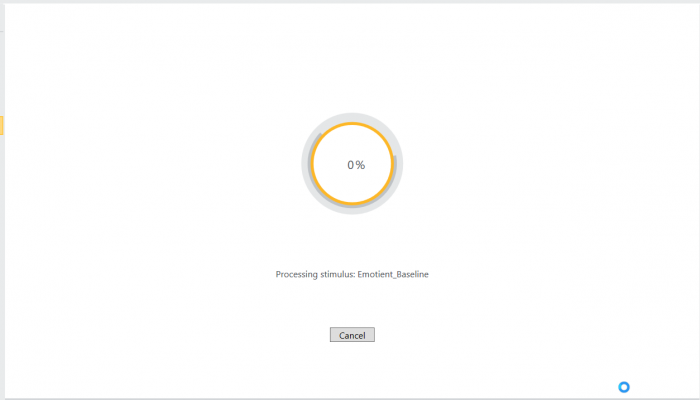
NOTE: Before being to able to analyze the recordings, all media must be rendered and full processed
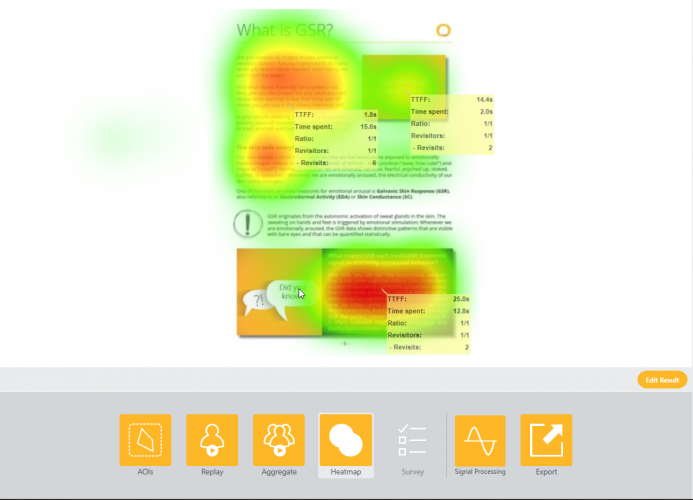
After loading, this screen will show up where certain features can be used to determine where the user has displayed such as gaze pathing which tracks the path which the eyes were going through, heat maps which displays areas where eyes focused the most, and facial expressional graphs that display the user's highest emotion during a period of time.
How to Export Data
1. Click Export
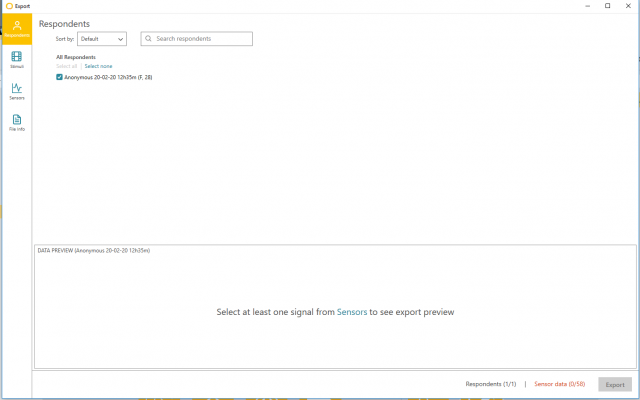
2. There will be a display of multiple options when choosing to export data from IMotions.
- Respondents: Select which respondent(s) you like to export data on
- Stimuli: Select the Stimuli(s) you'd like to export data on
- File Info: Select the location you'd like to save your data to and the type of data you'd like to export
How to Use OBS Studio
1. Press the Start (Windows Icon) and scroll down until you find the OBS Studio folder. Click the folder and then click the OBS Studio (64 bit) application.
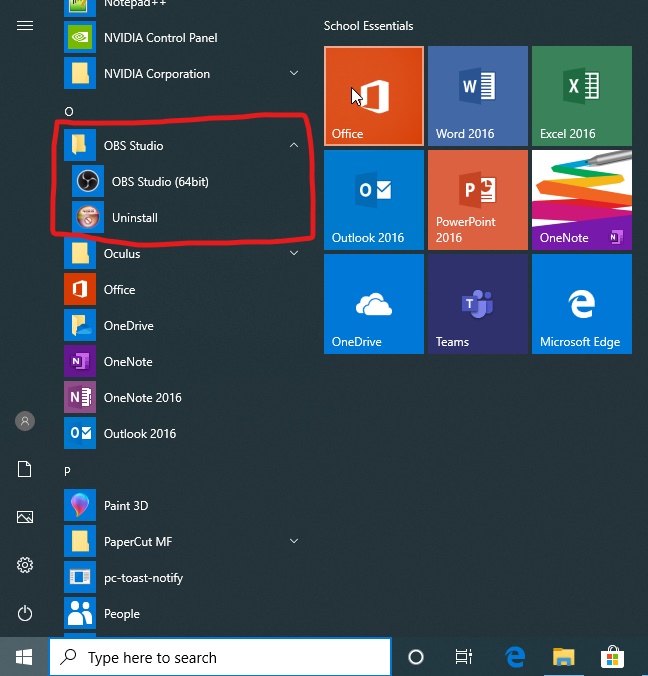
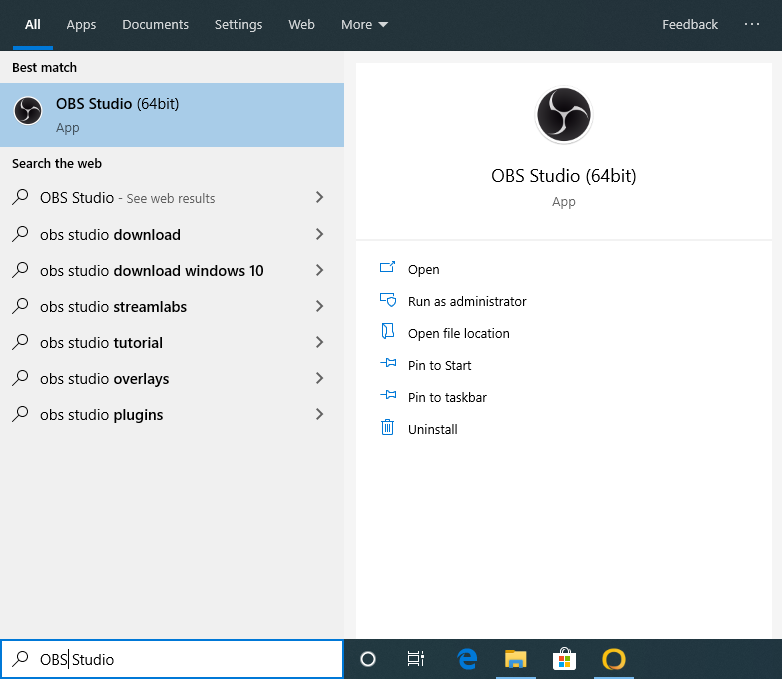
or in the search bar, type OBS Studio and if results exist click Open.
2. On the OBS Studio window, Search for the Sources panel located on the bottom. This is where the types of devices that can be chosen to be recorded.
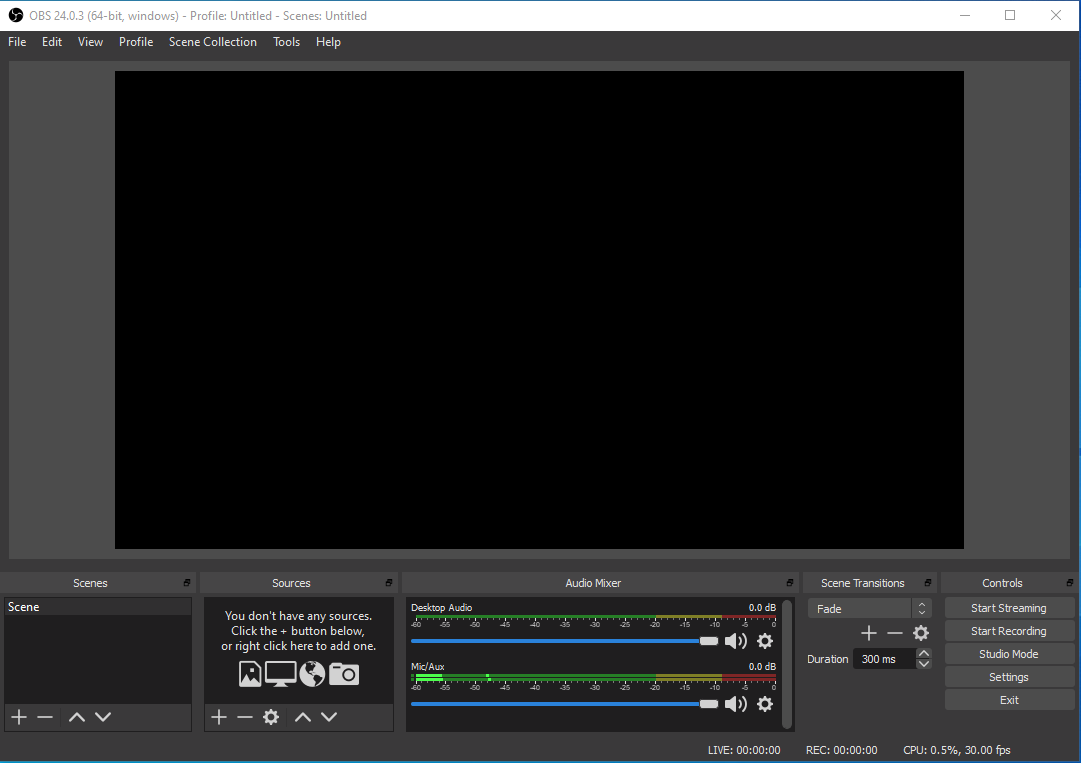
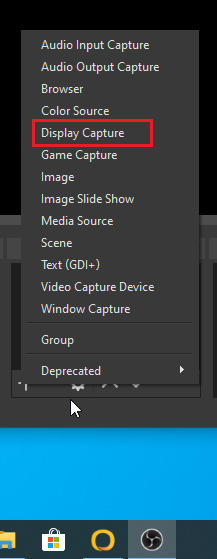
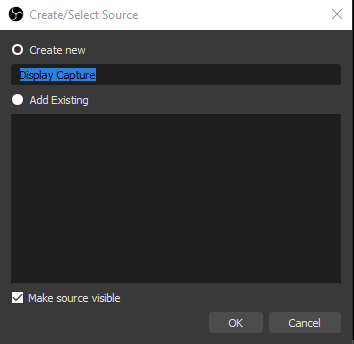
3. Click the Plus icon of the sources window.

In the list that appears, Click Display Capture
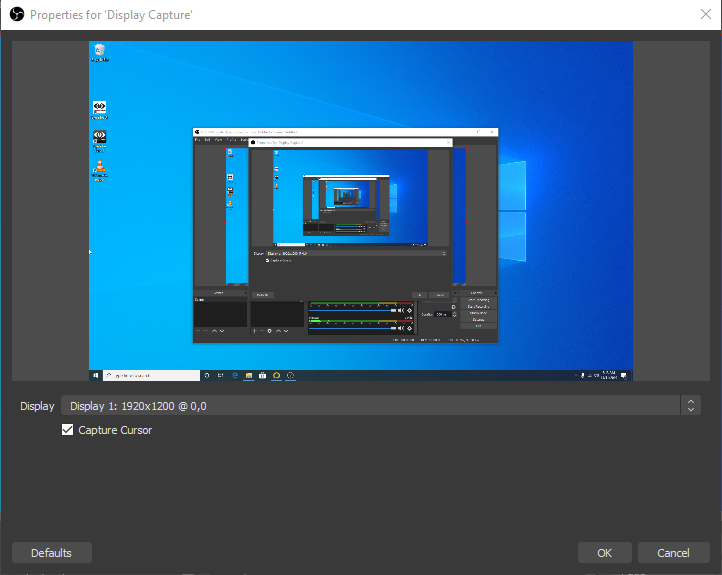
4. Click OK.
5. Click OK.
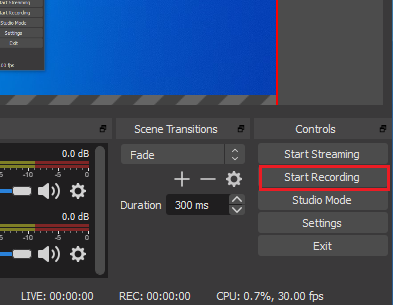
6. Now that the camera works in sync with the OBS Studio, Click Start Recording. The OBS will run the recording in the background and is only stopped when you press Stop Recording.
How to Use Greenshot
1a. Click Start (Windows icon), scroll down and find the Greenshot folder.
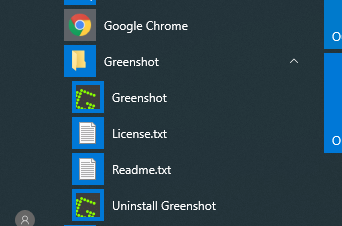
After Opening the folder, Click the Greenshot executable to start the application.
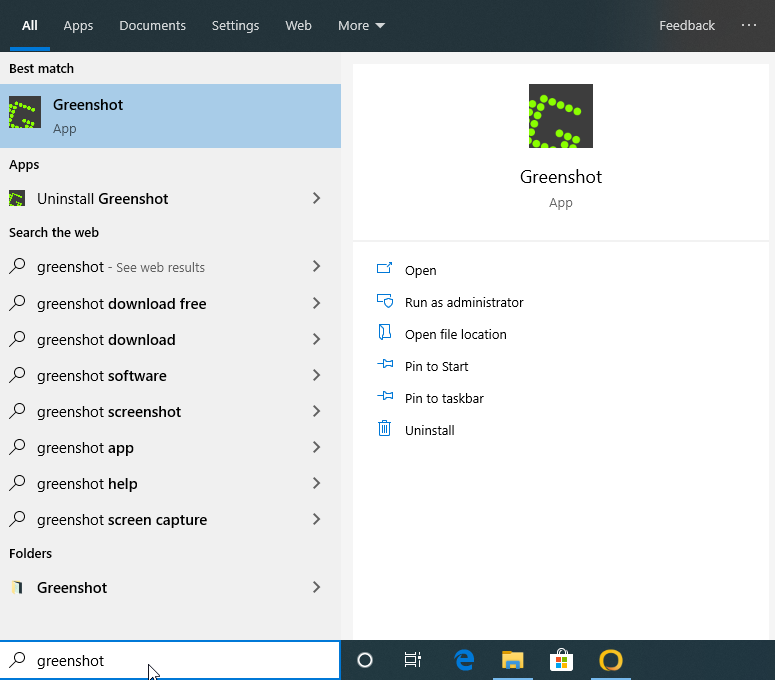
1b. Click the search bar, type 'Greenshot'. If there is a search result with the Greenshot Icon press Open option.
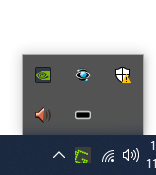
2. After opening Greenshot, the program starts to run in the background.
Look for the system tray(far right corner of your screen) and look for the Greenshot icon that should be displayed there.
When the same icon is right clicked, it displays a list of command that can be done to screen capture an area (size depends on the command type). This guide will focus on Screen Area Capture.
Screen Area Capture
1. Keyboards will vary with button combinations required for screen capture
a) The keyboards on the carts requires the user to press Fn + Print Screen
b) The keyboards on the table require the user to press Print Scrn
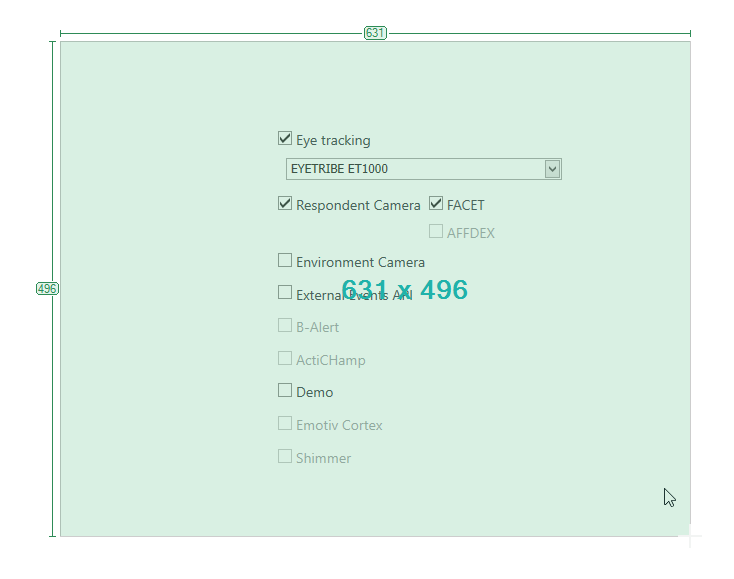
2. The mouse becomes into a targeting cursor and once clicking at a specific point, drag the mouse diagonal to the intended area
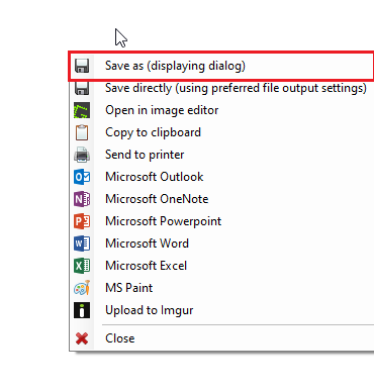
3. The captured area will display a drop down list with options to do with the current capture
Click save to save the current capture to the browsed folder.
Advanced Guide
This guide is to teach users the advanced and more expanded tools imotion has to analyze ad display data in the shape of graphs and statistics. This guide will also give a introduction in the user of the Shimmer, a skin response tool that measures the electric pulses the skin emits when the body acts on a certain emotion. As well as the EEG, a brain scanner that allows users to track how the brain reacts to certain responses given from internal and external mediums.
Setting Up Shimmer
1. The shimmer is paired to the computer through Bluetooth. From the computer's screen, make sure the Bluetooth is turned ON.

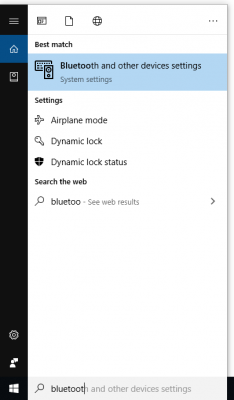
- In the case that Bluetooth is not turned ON, you'll want to go to Bluetooth and other device settings by simply searching it in the start menu and toggling it on
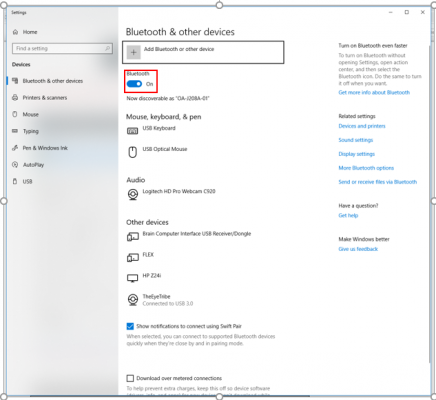
- You'll need to make sure to pair the shimmer to the PC by clicking on Add Bluetooth or other device. This will provide you a list of devices to be paired.
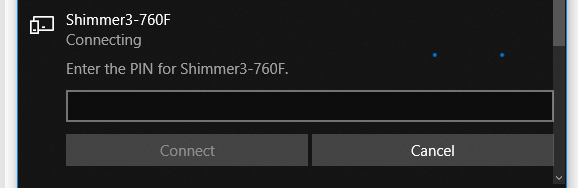
- Locate the device named Shimmer3-760F (Your name may be different, but it should say Shimmer). Click on the device and enter the pin code "1234" then click on Connect
2. Flip the switch on the shimmer to turn on the device and emit its Bluetooth signal, when your within the radius distance of the Bluetooth range of the computer.
3. Go on Imotions and go to the Sensor settings (Preferences > Sensor Settings). Scroll down and find the Shimmer Section.
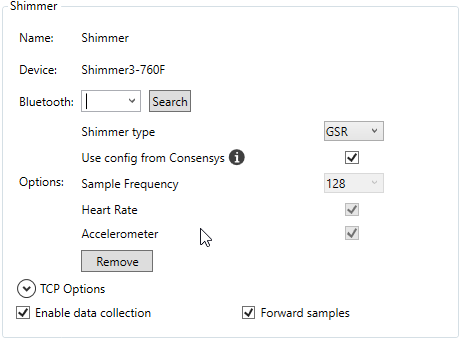
4. Click Search to search for any existing devices through Bluetooth. After Search press the drop down menu and select the only option available.
Note that this will only work on the computer HP ZR2440w as noted at the bottom left of the monitor screen. The computer second closest to the door.
Using Shimmer
NOTE: Please make sure that all components are properly connected before use to get accurate results.
1. Attach sensors, one on the index finger and one on the middle finger.
2. Make sure the finger the arms is attached to has limited movement through the test. The tested respondent(s) must respond with calmness, limited movements and talking, and normal breathing cycles.
When you press Record just like the eye tracker, the stimuli must go through the imotions own configuration test. However the Emotient. Baseline only looks and reads for eye tracker. Data is tracked and displayed on the line graphs.
Setting Up EEG
When the EEG is brought out of its package, the device will be without its sensors. The sensors are found in the small black compartment. When the compartment is open there should be 16 sensors tightly fastened
Part 1:
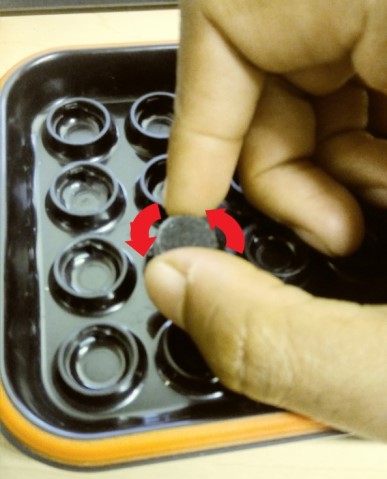
1. Before removing the sensors, they must be lubricated properly. Use the Biotrue multi-purpose solution to lubricate all of the sensors until they are soaking.
2. Gently twist counter clockwise one-quarter turn to remove the sensor from the compartment. Be very careful with them.
3. Place the removed sensor into the headset and twist clockwise one-quarter turn to tighten them in.
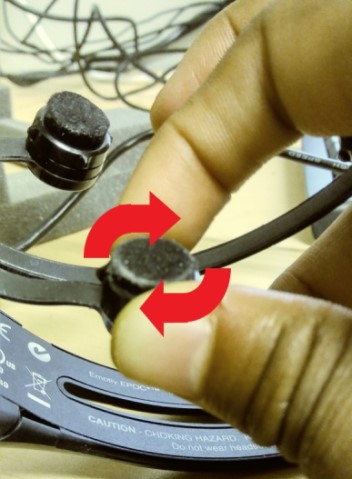
4. Repeat steps 1-3 to fasten all 16 sensors in the headset
5. Underneath the back of the headset, there is a switch. Shift the switch to power it ON. The device will connect to the USB dongle, that is already connected to the computer via Bluetooth.
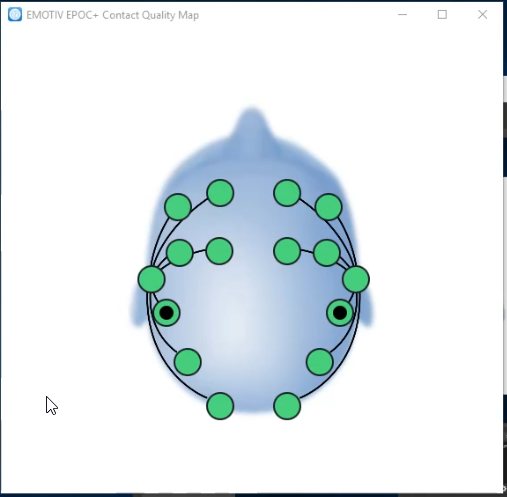
6. Open the CortexUI shortcut on the desktop screen.

7. When the application says Press Connect on the top of the window to connect any available emotive devices.

8. If it picks up, a grid with a head will show.
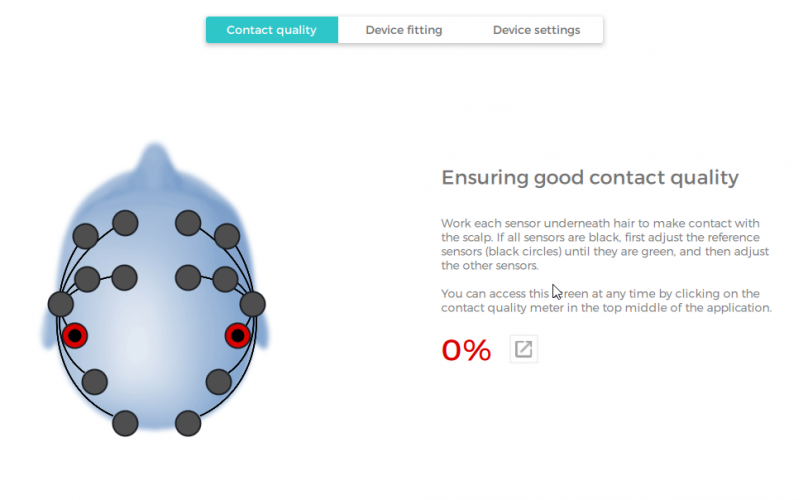
Make sure 93% or more of the sensors are green to move on to the next step.
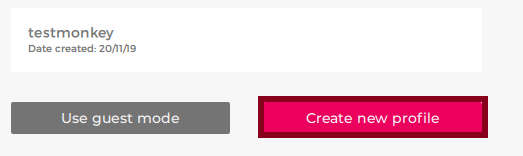
9. After connecting the sensors to either 93% or more, click the X to get off the current panel and enter training panel.
Click Create New Profile.
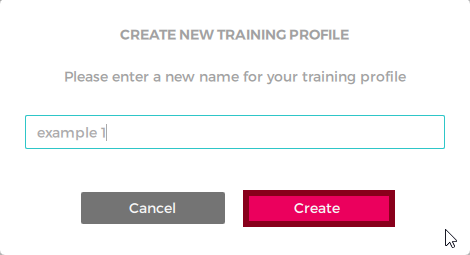
10. Enter a name and Click Create.
Using EEG
1. Click the newly created training session.
The EmotivBCI allows user to calibrate to many forms of brain activity. Each activity has training lessons to train the brain into those commands.
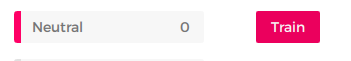
Mental Instructions
i. Brain must be trained for neutral lesson before any other lesson can be taken. Press Train beside Neutral lesson.
ii. Once succeeding in the Neutral lesson, you can start adding additional commands. Click the plus icon to beside Additional Commands to start adding more commands
iii. The training lesson chosen will be displayed on the lesson menu screen. Click Train to start the training session. Follow the instructions on the screen.
Note: Click the slider beside the name on the left. It can be used to turn off a command when the user decides not to use it.
The more lessons completed, the more lessons can be added. The limit is up to 4 lessons can be learned.
iv. After completing the lesson you are brought back to the brain scanner screen. On the lesson panel there will be a number beside the lesson. That number indicates how much the brain has been trained with that command.
v. Click Live Mode. In this mode, users can use all commands chosen from the lesson panel at the same time. It is recommended users only do one lesson per session so their brains don't get confused with too many commands.
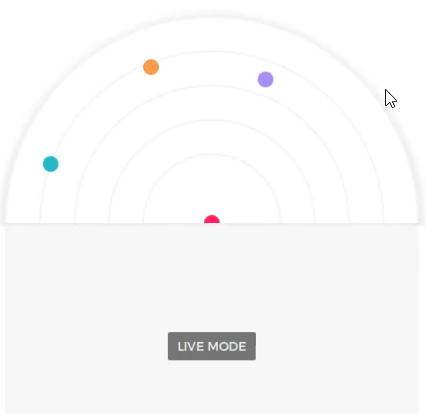
vi. That same number is also indicated as a circle above the Live Mode button. The closer the circles are too each other the harder they are to use. Create more space by training the brain more with the lessons.
Face recognition
i. To change into the Facial Recognition tab, press the Facial Recognition tab

ii. On the right hand side, similar top the Mental Instructions tab Facial Recognition through the EEG requires the user to go through a neutral lesson before calibration of any other lesson.
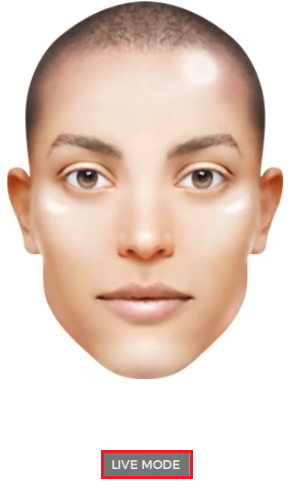
iii. Press Live Mode. In this mode the emotions that are trained from the lessons and acted from the brain are displayed to be visualized by a face.
Additional Stimuli Choices
Image
1. Click the Image Icon.
2. Find the location of the image file and press Open.
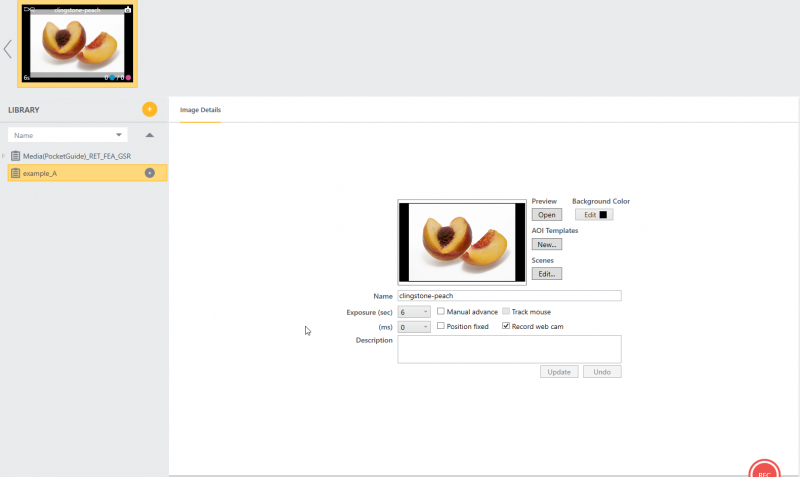
After adding to stimuli, the image can be modified limitedly
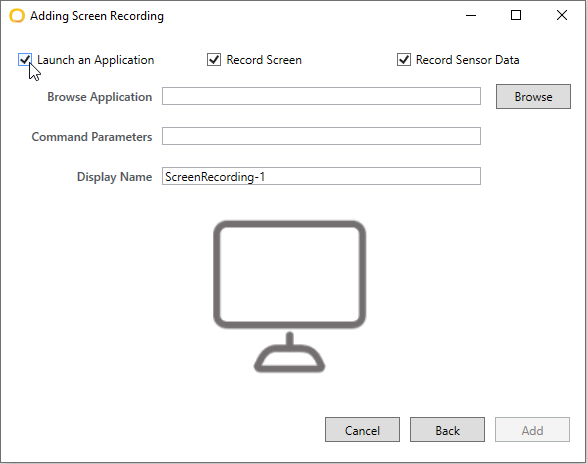
Screen Recording (Desktop display)
The Screen Recording (Desktop display) records any operation on the desktop. Can be used to focus on certain application(s)
1. Click the Screen Recording icon.
2. Click Launch Application to record data on a specific application. Click Browse to browse for application(s) located on this computer or a connected external device
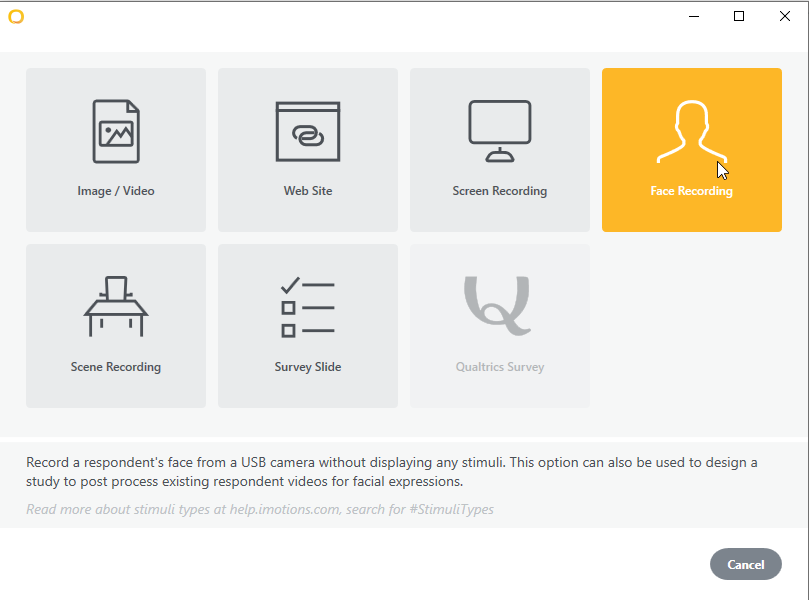
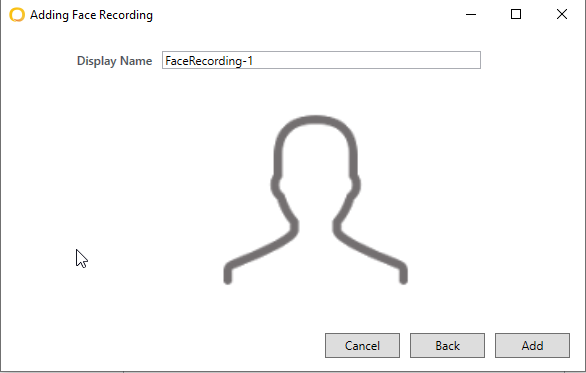
Face Recording
1. Click Face Recording.
2. Click Add. Changing name is optional.
Screen Recording (Environment Camera)
The Screen Recording (Environment Camera) will record the user and the area around the user using the Xbox camera (when using the carts, else will not function)
1. Click the Scene Recording icon.
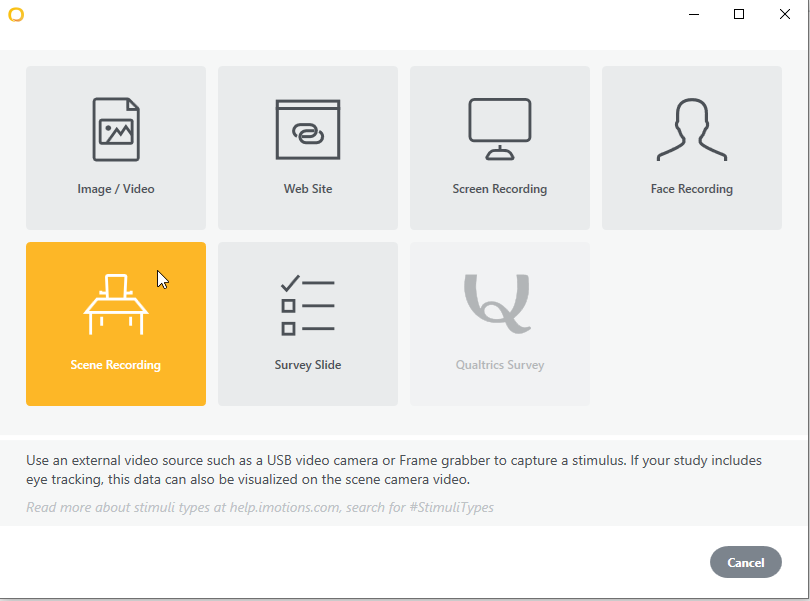
2. Click Add. Changing name is optional.
Additional Exporting Methods
The introduction to Imotions guide briefly went through the process of making an export. This guide will go through the various methods of exporting.
NOTE: For most exporting activities, click Export. Browse for the future exported location of the study.
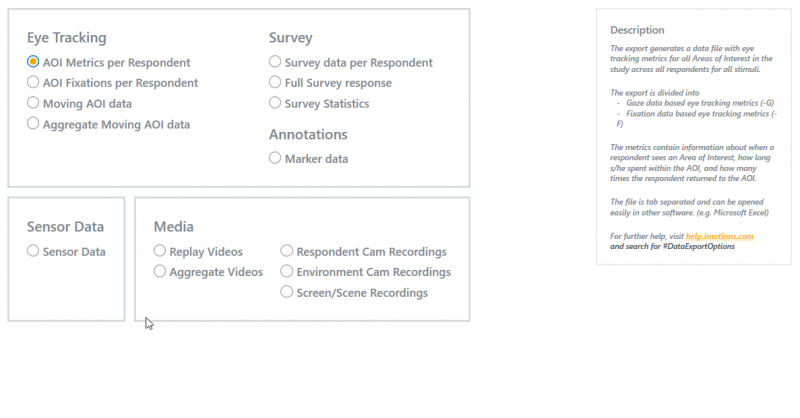
Eye Tracking
- This export creates a text file with eye tracking metrics for all Areas of Interest in the study across all respondents for all stimuli
- export divided into Gaze data and Fixation data based on eye tracking metrics
- the metrics contains data on how long and how frequent the respondent reacts to an Area of Interest
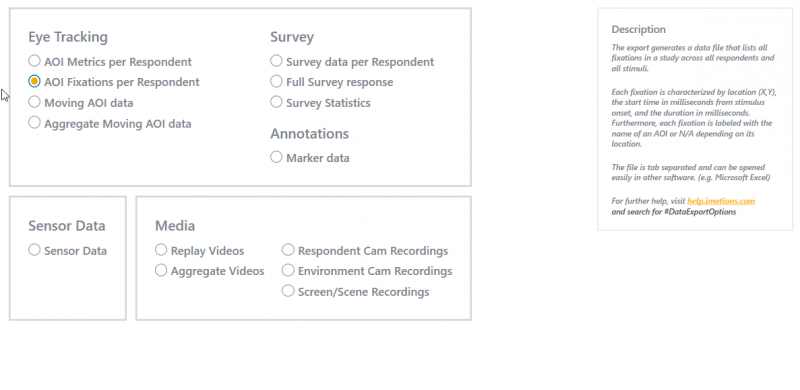
- this export generates a data file that lists all fixations in a study across all respondents and stimuli
- each fixation is represented by coordinates (X,Y), the start time, and duration and is labeled by the name of the AOI
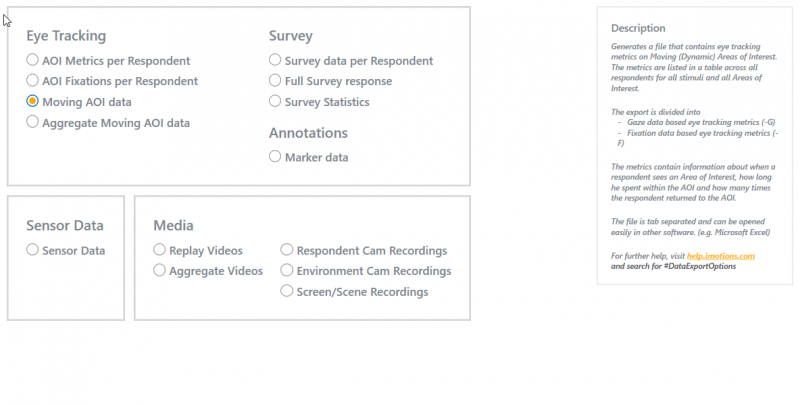
3. Moving AOI data
-
generate a file that contains eye tracking metrics moving in AOI
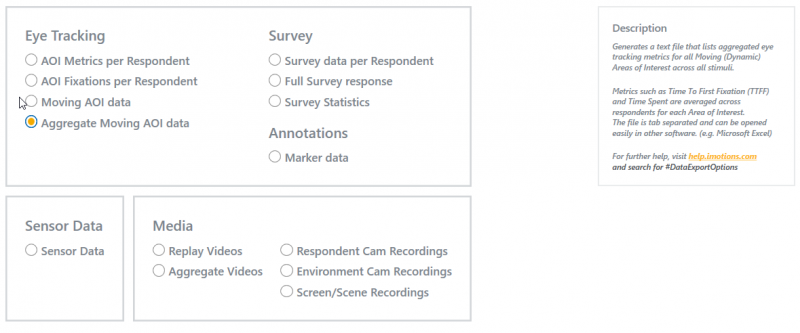
4. Aggregate Moving AOI data
-
generates a text file that lists aggregated eye tracking for all Moving AOI data
Surveys
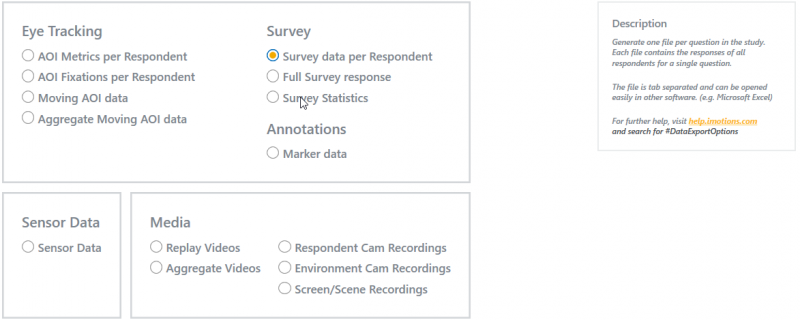
1. Survey data per Respondent
- Generate one file per question in the study
- each file contains the response of all respondents for a single question
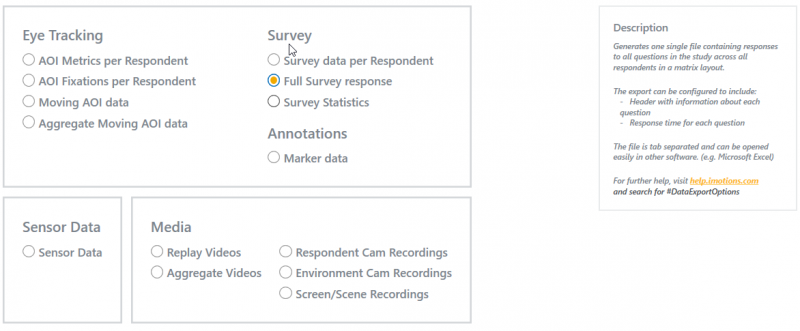
2. Full Survey Response
-
generates one single fil containing al; the respondents answers in the study across all respondents
- can be configured to include the question text and/or the response time for each question
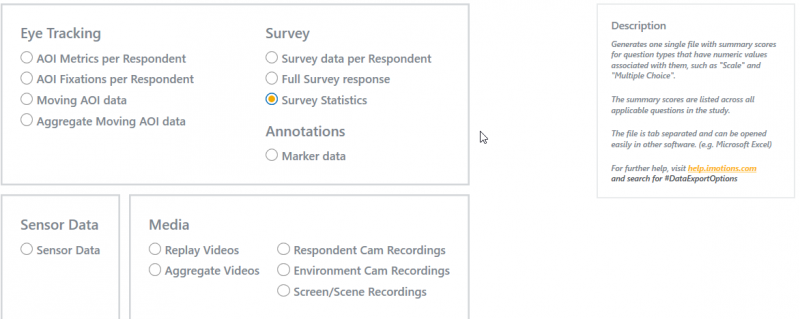
3. Survey Statistics
- generate one single file with summary scores for question types that have numeric values associated with them, such as Multiple Choice and Scale
- The summary scores are listed across all applicable questions in the study
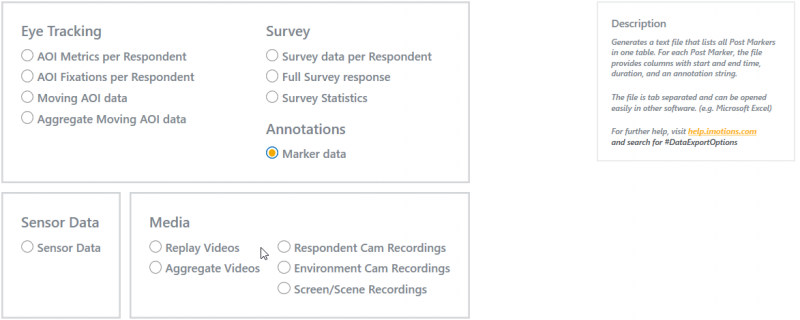
Annotations
1. Marker Data
-
generates a text file that lists all Post Markers in one table
- for each post marker, the file provides columns with start and end times, duration, and an annotation string
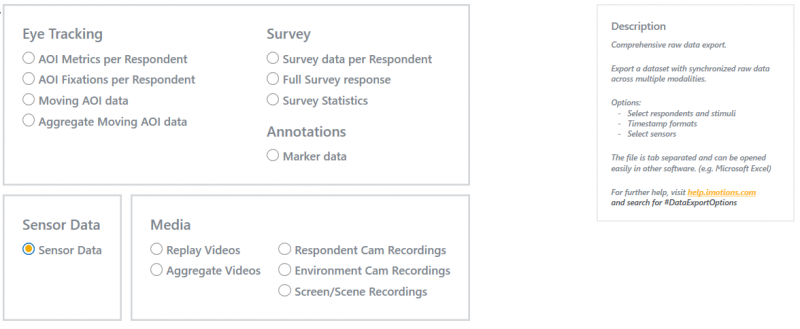
Sensor Data
- Selected by default. Exports raw data based on the choice of sensor wished to export.
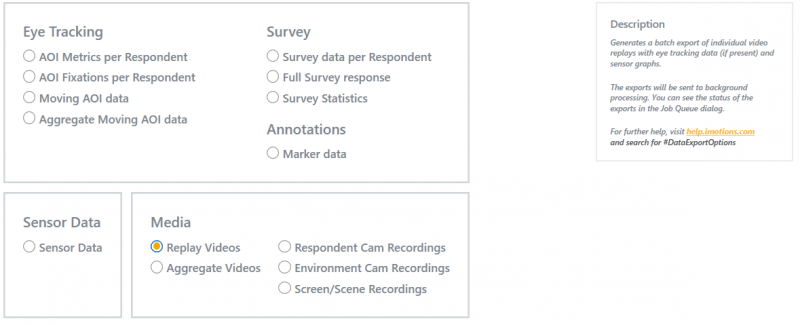
Media
1. Replay Videos
Generates a batch export of individual video replays with eye-tracking data(if present) and sensor graphs
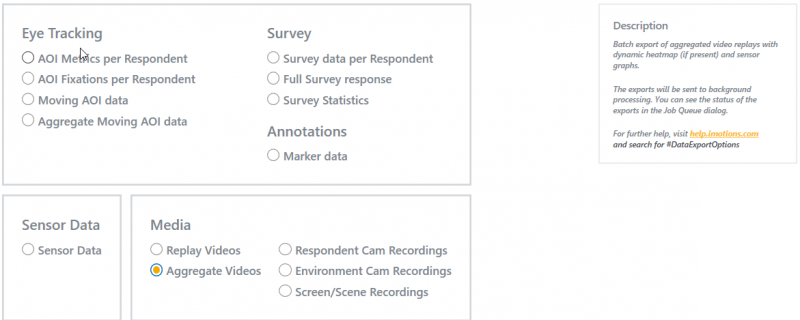
2. Aggregate Videos
Batch export of aggregated video replays dynamic heatmap (if present) and sensor graphs
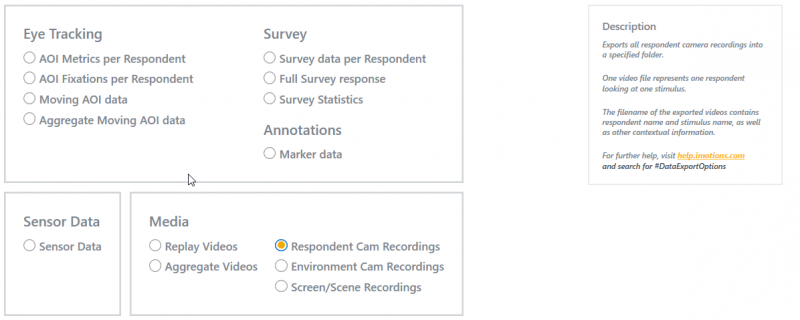
3. Respondent Cam Recordings
Exports all respondent camera recordings into a folder chosen by the user
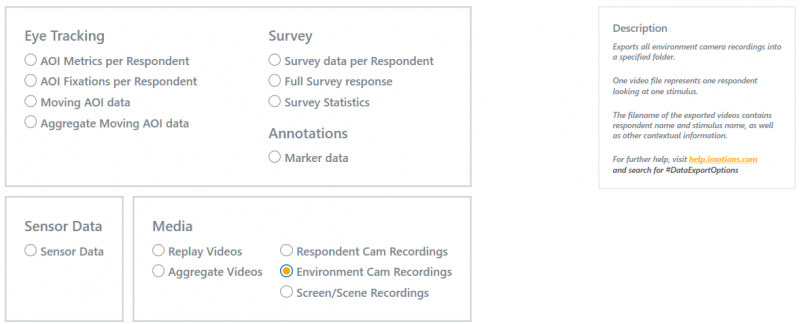
4. Environment Cam Recordings
Exports all environment camera recordings into a folder chosen by the user.
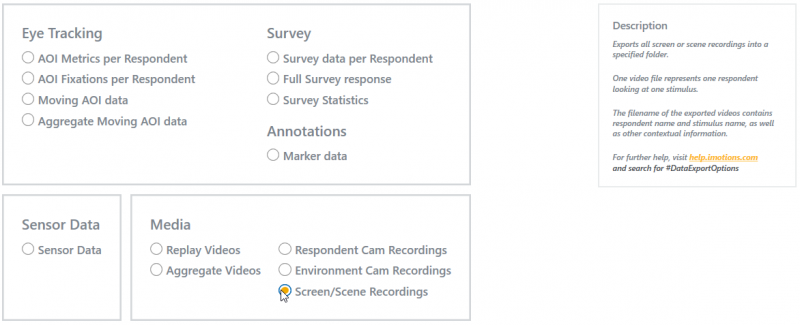
5. Screen/Scene Recordings
- Exports all screen or scene recordings into a folder chosen by the user
EEG
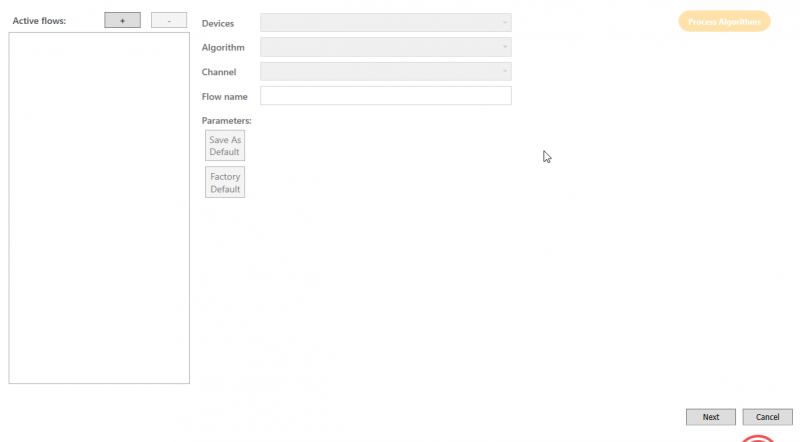
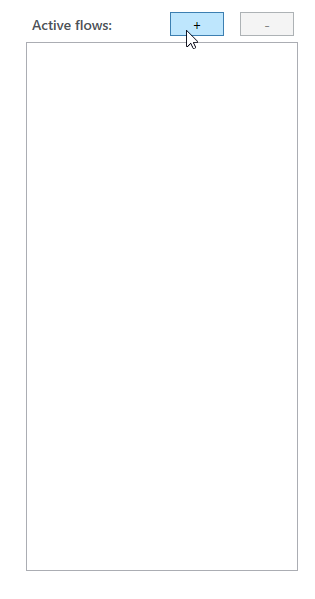
Before Exporting EEG data, the signals must be processed when building the analysis.
1. Under Signal Processing, click the plus button to Add new flow
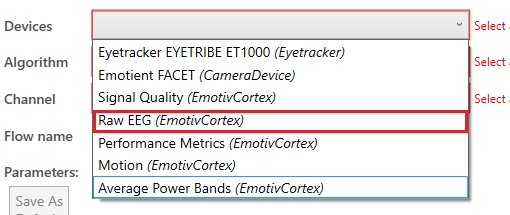
2. Press the drop down by Devices. Signal Processes vary between device source. For this guide locate Raw EEG.
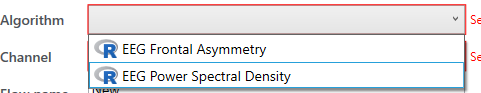
3. Click the drop down by Algorithm.
- Frontal Asymmetrical
Frontal Asymmetry produces an export of data that analyses the respondents' interest in the study There are 2 pairs of front sensors that can be observed; f3 and f4 or f7 and f8.
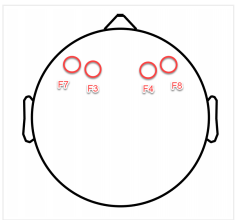
These sensors are used to track the activity in the left and right of the frontal lobe. If the right frontal lobe has more activity than the left, the user would have more interest in the stimuli in front of them.
On the paramaters panel, Click the drop down beside Electrodes of Interest. Pick an option available if there is an interest from either pair. Else, keep on default.
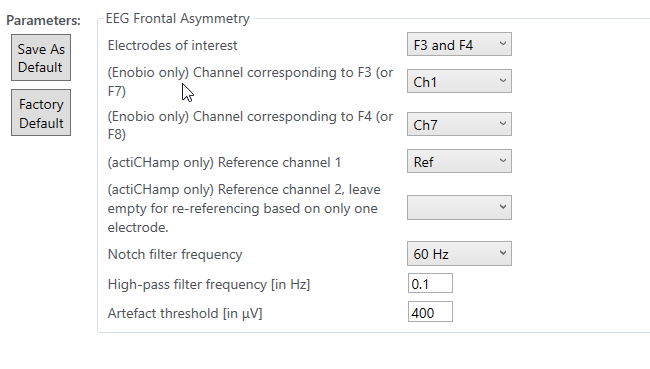
Keep rest on default. Click the Save As Default. to save the current parameters for this active flow.
Click Next (Update if its to change a current analysis).
- Power Spectral Density
Power spectral density works like the visible spectrum. The white light when passing through a glass prism is separated into many colours. The PSD is taking the raw EEG data and divides it into separate wavelengths which can be recorded separately.